SECReTE10 domains in Aspergillus niger and Streptomyces lividans (Part 2)
- Dec 30, 2022
- 5 min read
In the previous part, I described that the SECReTE10 domain is a newly discovered mRNA domain, which plays an important role in secreted protein production. I ran some initial statistical analysis and showed that codon usage is an important factor determining the abundance of these domains. Below I continue my analysis using Monte Carlo simulations and propose a new way to compile a codon usage table. This information can be used by those interested in increasing protein production through the use of gene optimization. Gains reported by codon usage optimization can be as high as a 1000 fold increase in protein production.
What are Monte Carlo simulations?
Monte Carlo simulations are a simple way to model probability outcomes using random sampling when it is not easy to predict the outcome in other ways. For example, if we have a six sided dice and want to figure out the frequency that we will get the number two, we would simply start throwing the dice and write down all the times we get the number two or any other number. Using this simple approach we will find that in approximately 17% of the roles we get the number 2. In our case, we want to know how many SECReTE10 domains are formed simply by randomly choosing codons based on a codon usage table and use this information to approximate the abundance that is observed in nature. In this way, we can add selection for SECReTE10 domains and/or codon adaptation and determine the amount of SECReTE10 domains caused by these variations.
Fraction and number of SECReTE10 domains is best explained by codon usage bias
In this section, I will use the Aspergillus niger CBS513 dataset as a demonstrator for the Monte Carlo simulations and at the end of this post the charts for Streptomyces lividans 1326 and Saccharomyces cerevisiae are shown. So let us start by seeing what happens when we just randomly select codons based on the codon usage of all fractions (secreted, transmembrane and cytoplasmic). As is shown in the figure below, the fraction of sequences with a SECReTE10 domain (orange bars) is surprisingly similar to the fraction observed in WT sequences (light blue bars). However, the average number of SECReTE10 domains per sequence is approximately half of what is seen in the original secreted fraction. These results comfirm the previous observation that secreted and transmembrane sequences contain amino acid regions that are more likely to encode SECReTE10 domains compared to cytoplasmic sequences, but do not explain the presence and abundance of the observed SECReTE10 domains.
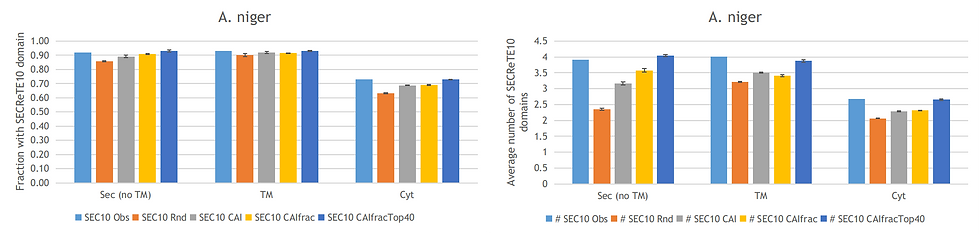
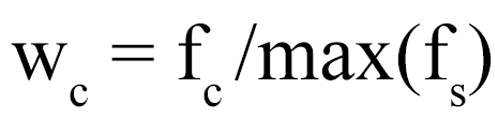
In nature, codon usage is not random and highly abundant proteins tend to be encoded by sequences enriched for specific codons. This is also known as codon usage bias and can be accessed by calculating the codon adaptation index (CAI). The CAI of a gene is simply the geometric mean of the relative adaptiveness w(c), ratio between the observed frequency f(c) of the codon c and the frequency of the most frequent synonymous codon f(s), of each codon over the length L of the gene sequence in codons. The Monte Carlo simulation was performed again this time using the codon usage of all fractions and selecting for codons to match the CAI of the original (WT) sequences (grey bars). This resulted in an almost identical fraction of sequences that contain one or more SECReTE10 domains and improved the average number of SECReTE10 domains per sequence. However, it remains lower than that observed in the original sequences.

I continued by running several additional Monte Carlo simulations, which are not shown here. The most relevant of which is the addition of selection pressure for the amount of SECReTE10 domains. Although, this led to an increase in the average amount of SECReTE10 domains per sequence, it also caused almost all sequences to have at least one SECReTE10 domain. Even with a simulated low selection pressure (best out of 10), approximately 99% of all sequences contained a SECReTE10 domain and for many sequences there were more SECReTE10 domains than observed in the original sequences. This could indicate that there is no selection pressure for SECReTE10 domains or that the selection pressure for SECReTE10 domains is not uniform (for example only present in highly expressed sequences). Since there is no correlation between the presence of a SECReTE10 domain and expression level, CAI or any of the other factors examined, I continued running Monte Carlo simulations without selection pressure for SECReTE10 domain.
The next Monte Carlo simulation was performed with a CAI calculated using the codon usage of the individual fractions (yellow bars). This improved the average number of SECReTE10 domains, but only for the secreted fraction. It is known that ideally, the reference set in the CAI calculation is composed of highly expressed genes. Therefore I downloaded expression data for A. niger CBS513, S. lividans 1326 and S. cerevisae and ran several Monte Carlo simulations to determine which fraction of highly expressed genes is able to best explain the observed SECReTE10 domains. For example, I ran simulations with the top 10, 20, 40 and 100 most highly expressed genes, but this still did not give a comparable fraction and number of SECReTE10 domains.
The rationale for choosing the most highly expressed genes is dual, (i) highly expressed genes need to compete for limited resources such as tRNAs in fast-growing organisms and (ii) they also need to be more accurately translated. However, I can imagine that it is beneficial to reduce competition between secreted, cytoplasmic and transmembrane sequences by having a slightly different codon usage bias for these important fractions. To test this theory I only used the top 40 highly expressed secreted sequences to optimize the secreted sequences and I did the same for the cytoplasmic and transmembrane fractions. This led to similar results as observed in the WT sequences for the secreted fraction and the transmembrane fraction, but not for the cytoplasmic fraction. When using the top 40 highly transmembrane sequences to calculate the CAI, the results for the cytoplasmic fraction improved significantly. Now all three fractions have a similar fraction and average number of SECReTE10 domains (dark blue bars) as the original sequences.
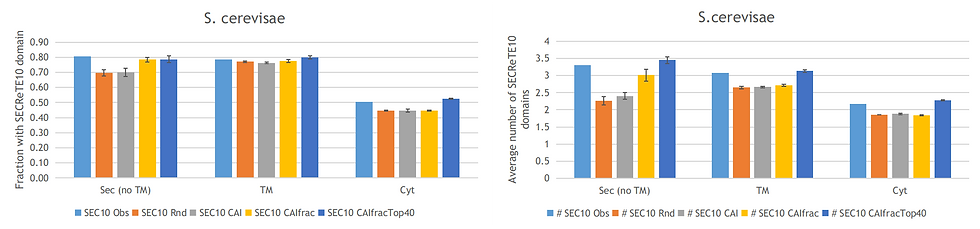
I continued by running several of the Monte Carlos simulations for S. lividans 1326 and S. cereviase and these give comparable results (see figures below). Taken together these results indicate that secreted proteins should be optimized using the codon usage bias of the top expressed secreted sequences instead of the codon usage bias of all sequences as is done by some gene synthesis providers. Moreover, cytoplasmic and transmembrane sequences are best optimized using the top highly expressed transmembrane sequences and not by applying the same optimization as done for secreted proteins.


Comments