Alternative set of pKa values
- Oct 25, 2021
- 3 min read
Updated: Nov 27, 2021
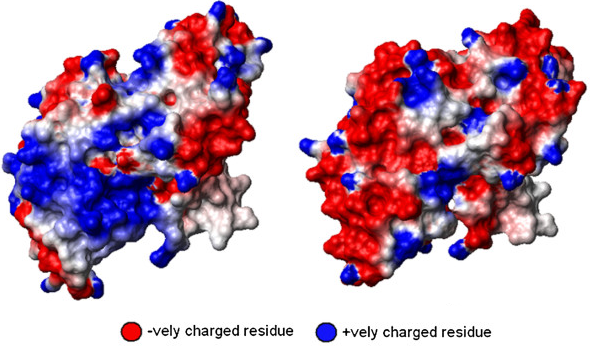
The isoelectric point (pI) is the pH at which a protein carries no net charge. Knowing the correct pI is especially important when performing protein purification. In this post I use a newly created set of pKa values to calculate a theoretical pI value of a benchmark set of proteins. The resulting pI values turned out to be very close to the experimentally verified ones and more accurate than any others published.
What is the isoelectric point (pI)?
As mentioned in an earlier post, the isoelectric point is the pH at which a protein carries no net charge. The isoelectric point of a protein depends mostly on the presence of ionizable groups of seven charged amino acids (AA properties) and their acid dissociation constants (pKa). These seven amino acids, (glutamic acid (E), aspartic acid (D), cysteine (C), tyrosine (Y), histidine (H), lysine (K) and arginine (R)) in combination with the charge of the amine and carboxyl terminal groups determine the pI of any protein. The charge of the terminal groups is especially relevant for short proteins and peptides.
Usually, the values of dissociation constants for pI calculations that are based on the Henderson-Hasselbalch equation, are determined experimentally and depend on the procedure used. However, given a set of proteins with a known pI, it is also possible to determine the pKa values by applying computational techniques. In my experience, the best technique for this purpose is to use simulated annealing.
What is Simulated annealing?
Wikipedia describes simulated annealing as a probabilistic technique for approximating the global optimum of a given function. Specifically, it is a metaheuristic to approximate global optimization in a large search space for an optimization problem. In other words, simulated annealing can be used to find the best pKa values (out of a huge selection of possible values) of the seven amino acids plus two terminal groups that will allow us to accurately predict the pI values of the proteins using the Henderson-Hasselbach equation.
So, how exactly does simulated annealing work? The simulated annealing algorithm randomly selects an optimal solution close to the current one, measures its quality, and moves to it according to the temperature-dependent probabilities of selecting better or worse solutions . The temperature value is slowly decreased at each step as the solution space is searched (see image below). In our specific case, similar to the IPC paper, the quality (of the solution) is determined using the Mean Squared Error (MSE) between the proposed solution and the experimentally derived pI values. When the temperature finally reaches zero, we end up with an approximate best set of pKa values.

Resulting SA pKa values
The table below shows the pKa values as determined experimentally (PKAD database) and the results of two computational methods basin-hopping (IPCprotein) and simulated annealing (SAprotein).
The original IPC paper compares itself to 15 other pKa sets and these are left out here for brevity. To my surprise, the MSE could be further improved, although only slightly, using the simulated annealing method compared to those published in the IPC paper. The root mean squared error (RMSE) is reduced by 0.01 pH point on average compared to the IPC_protein values and as much as 0.15 pH point compared to the experimentally derived pKa values as found in the PKAD database. Moreover, the pKa values approximated using simulated annealing are closer to the experimentally derived values compared to the IPC values and therefore might show important similarities and deviations.
The largest difference between the simulated annealing values and the PKAD values are the due to the pKa value of cysteine. Cysteine often forms disulfide bridges and this might be reflected in the higher pKa values. Furthermore, there are only 18 experimentally derived pKa values in the PKAD database while the protein dataset of the computational methods contain over 12000 cysteines.
Another interesting deviation is the pKa value of arginine (R). The pKa value of arginine is difficult to measure by titration as proteins denature at such high pH, resulting in very few experimentally derived values. Therefore, in most textbooks, the pKa of arginine is set around 12 but there is a paper that determined the pKa value to be as high as 13.8 (Fitch et al., 2015).
The observed discrepancy between the computational and experimental values cannot be simply due to post-translational modification, since modifications such as methylation do not substantially alter the experimentally measured pKa value (Evich et al., 2015). Even newer methods such as the recently described deep learning model only predict a pKa value of about 12 (IPC2). Whatever the reason, it might indicate that despite the high experimental pKa value of arginine, its real contribution to the pI of proteins is lower.
For those interested, I added these pKa values to the pI preditor and you can try it here.


Comments